How NIQ’s New Nutrition Scoring Could Guide Pricing

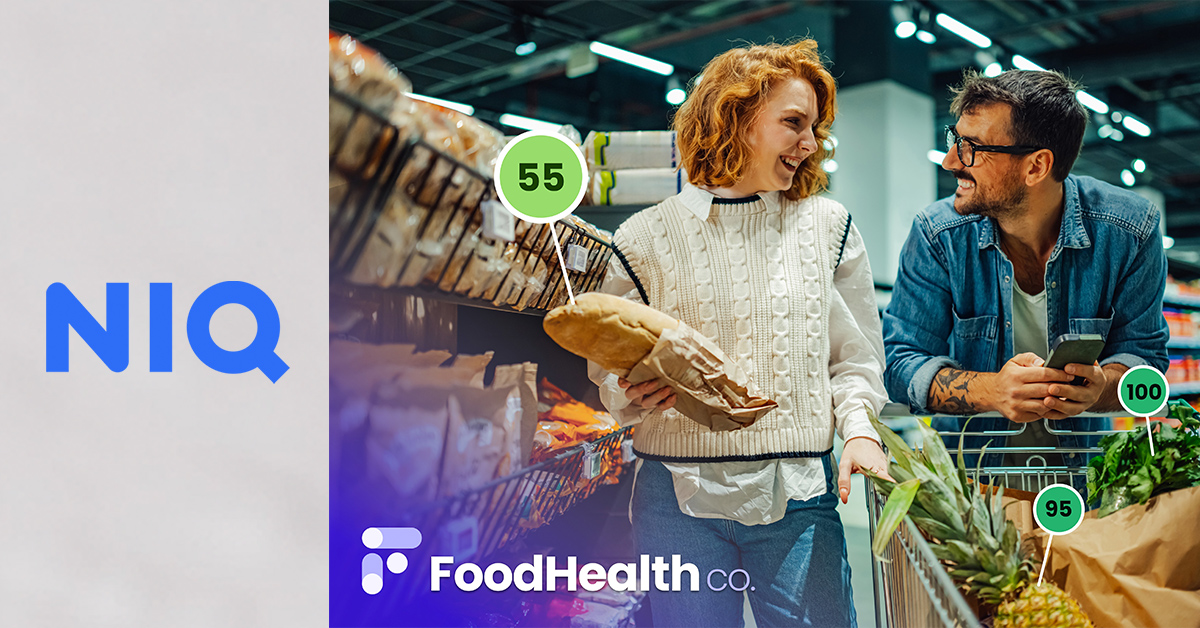
NielsenIQ (NIQ) has officially joined forces with nutrition intelligence platform FoodHealth Co. (formerly bitewell) to integrate their respective datasets. That data partnership enables brands to spot and craft pitches around their products’ incrementality and the gaps it could fill in a retailer’s set on the basis of price, health and how those two factors affect consumer purchasing habits.
The partnership marks the first time NIQ has offered “a comprehensive nutrient scoring system,” the data platform said in a release; FoodHealth Score, the tool created by FoodHealth Co., evaluates products based on nutrient density and ingredient quality.
“We realized that there are so many ways that our data and [NIQ’s] data together can be useful in moving the industry forward as we look to support a consumer who is increasingly focused on their health and on understanding and making what I call ‘health-price trade-offs’ every time they shop,” FoodHealth Co. CEO Sam Citro Alexander told Nosh.
As the Make America Healthy Again movement has brought food and nutrition conversations into the mainstream, and apps such as Yuka have allowed consumers to rank and file food choices as they stroll grocery store aisles, FoodHealth Co aims to bring this type of decision-making higher up in the industry to allow both brands and retailers to tune assortments to customer demands.
In May, FoodHealth Co. closed a $7.5 million Series A round co-led by Reach Capital and Ulu Ventures, with participation from Supply Change Capital, ReThink Food, and existing investors such as Refinery Ventures, Mudita, Antler and others.
Alexander said when FoodHealth Co, which has been integrated across all Kroger-owned stores prior to this new partnership, starts working with a new trade partner, the retailer first wants to understand how its assortment compares to the rest of the industry as well as how it meets consumer expectations. She emphasized that the combination of both data sets now allows retailers to understand what categories consumers are willing to trade up for on the basis of health.
“Consumers are increasingly prioritizing health in their food choices, and the industry is taking notice,” said Marsha McGraw, global head of partnerships and verticals at NIQ, in a statement. “By integrating the FoodHealth Score, we’re giving retailers and manufacturers a clear, data-backed way to evaluate product health impact and respond to evolving consumer expectations. This isn’t just about data, it’s about shaping a healthier food landscape.”
For example, consumers have demonstrated they will trade up on a product like peanut butter, sometimes spending upwards of $2 more, simply due to a product’s health score, Alexander said. However, not all areas of the store see that type of interest and response, she emphasized, pointing to the candy aisle in particular.
“The majority of people are looking for something tasty, something they love, something that’s a sweet treat that they enjoy, and so there’s not as much pricing power that we’re seeing for a healthier version in that aisle across, but I’m talking like very broad strokes across the U.S. population.”
Those insights have also been a contributor for retailers to reformulate private label products, Alexander said, allowing them to understand how their store brand offerings fit in among branded players and tweak those products to “fit better with the food health score that a consumer is expecting for that price point of product.”
“We can look at the retailer’s assortment and say, ‘Okay, by category, by subcategory, by sub commodity, what is your food health score distribution?’ And ‘do you have choices across the spectrum where people can swap’ – essentially ‘do you have any holes in your assortment?’” Alexander explained. “Nielsen’s data comes in and says, ‘Okay, and this is how you compare to the rest of the market. And this is where you have holes in your assortment’ and actually maps out incrementality in your opportunity set.”
Those insights are also effecting change around pricing strategies, she said. This data has been embraced by brands as they work to understand how their pricing strategies compare to competitors making similarly scoring products, and to innovate new formats to fill price gaps.
“For categories where that retailer might be missing a cereal that scores within the range of 50 and 60 and is in the $3 to $4 price point – it arms brands with a really great common language data set that they can go to a retailer with to prove out their value.”
Alexander noted that the demand for this tool comes at a time where this work is happening in many different spheres, with different definitions around health, contributing to a lack of clarity on what factors are actually driving sales.
“Is it foods that do or don’t have red dye? Is it foods that do or don’t have seed oils? Is it foods that do or don’t have added protein? What’s the thing that’s driving [sales]?” she said. “When you simplify it for the consumer down to one number that contains the multitudes of possible reasons why a person buys food for their health, that’s where there’s power. I think that’s where you start to get a clear indication of consumers making a health-price trade-off.”
Explore the Nombase CPG Database
Head to Nombase to learn more about the tagged companies and their offerings.