The Drivers Behind Shoppers’ Purchasing Decisions
Wouldn’t it be nice if brands could identify the reasons behind consumer purchasing decisions and then use that information to develop their marketing strategies? In its recently released “The Why Behind the Buy” report, Acosta Sales and Marketing examines what drives consumers when they shop.
Acosta, a consumer packaged goods marketing agency, produced its report using data culled from online surveys nationally representative sample of U.S. shoppers. The report analyzes consumers’ purchasing decisions.
According to the report, shoppers’ responses to marketing strategies vary based on category. Findings from the report should help CPG food and beverage entrepreneurs target their sales and marketing efforts to the areas where it most affects the shopper.
The following sections will focus on what drives consumers to shop, how they decide on where to shop, what they buy, and how marketing tactics affect the process.

What Drives Consumers To Shop and Spend More?
Acosta research indicates that consumers who enjoy the grocery shopping experience spend more on the shopping experience. For brands, this group seems to be with millennials and shoppers with children, both of whom expect to increase grocery spending in the 2015 year.
- Fifty-eight percent of shoppers say they enjoy shopping.
- Sixty-nine percent of millennial shoppers enjoy grocery shopping because they say it is relaxing.
- Sixty-eight percent of shoppers with kids enjoy grocery shopping citing keeping household happy w/ the products they buy as the reason.
- Thirty percent of younger shoppers (ages 18-48) and 37 percent of shoppers with kids say they expect to increase grocery spending.
- Seventy-one percent of older shoppers (ages 49 and up) and 74 percent of shoppers without kids expect grocery spending to stay the same or decrease in the coming year.
- With lower gas prices, 72 percent of shoppers ages 18-34 report they will spend it on groceries while 68 percent of shoppers ages 35-54 plan to spend it on paying bills and 42 percent of shoppers ages 55 and above plan on putting the money into savings.

Where Do Consumers Shop and How is That Decided?
Acosta reports that price, location and selection are the foundations of what a grocery store needs to attract shoppers. After that, lifestyle and convenience ultimately determine which avenues consumers decide to shop at. Channels like convenience, drug and natural are popular among the younger generations, while online and omnichannel are showing promise with millennials and shoppers with kids.
- In the past 6 months, 95 percent of shoppers reported buying household groceries from regular supermarkets; followed by 79 percent at mass merchandisers; 42 percent at warehouse/club; 39 percent at dollar and drug; 25 percent at convenience stores; and 21 percent at natural/organic grocers.
- Overall, shoppers still buy most of their grocery items from a grocery store, but younger groups like Gen X and millennials show greater interest in convenience stores, drug stores, and natural/organic grocers.
- Twenty-seven percent of shoppers reported purchasing a grocery item online at least once a month over the past year, up from 23 percent reported just six months earlier. Four in 10 of those currently shopping online said that they expect to increase their order frequency in the next year.
- MasterCard study analyzing transactions between 2013-2014 across online and brick-and-mortar stores found the largest absolute omnichannel spending was found in the grocery channel.
- Millennials and shoppers with kids are the heaviest users of online and omnichannel grocery shopping.
- Top features most important to shoppers at a grocery store include price (56 percent), proximity (39 percent), and overall selection of products (33 percent).
What Do Shoppers Buy and How is That Decided? Do Brand Names Matter?
Most shoppers decide what category of products to buy when they are at home, however many opportunities exist for brands to influence purchasing decisions because over half of shoppers don’t decide on a brand until they are at the stores.
- Seven in 10 shoppers make the decision to shop a particular category at home, but 55 percent of shoppers decide what brand to buy while in stores.
- Decision to purchase from perimeter departments such as bakery and prepared foods are typically made in store.
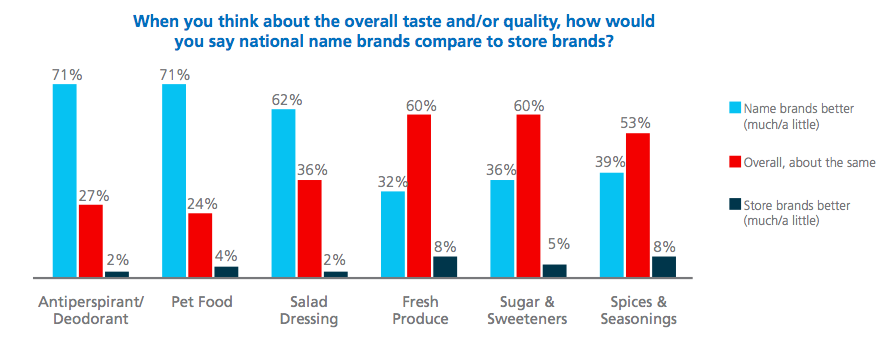
- In terms of overall quality or taste, consumers felt antiperspirant (71 percent), pet food (71 percent) and salad dressing (62 percent) were categories, which brand names were superior.
- When a specific product is not available, the majority of consumers across all grocery categories will opt to switch products.
- Carbonated soft drinks (41 percent), pet food (41 percent), and shampoo and conditioner (39 percent) were top categories in which consumers would either delay purchase or go to another store if the product they had in mind was not available. This “walk rate” is compared to that of frozen vegetables at 22 percent, breads at 23 percent and shredded and packaged cheeses at 23 percent.
Do Marketing Tactics Matter and Who Should be Targeted?
According to Acosta, marketing tactics do matter, but its impact varies by category. Sales of products on shelves seem to have a big impact on snack and soft drink decisions, while in-store flyer promotions seem to work on food products geared toward children.
In terms of a target audience, the female head of household and shoppers with kids spend the most time in grocery stores, but clearly, different members of the household affect different category purchasing decisions as seen below.
- Thirty-three percent of shoppers said sales on the shelf impacted their decision when buying chips, pretzels and salty snacks; followed by 31 percent for carbonated soft drinks; and 31 percent for frozen appetizers and snacks.
- Twenty-seven percent of shoppers were impacted in their consideration for frozen breakfasts when coupons were available for the products.
- Twenty-five percent of shoppers were impacted by in-store flyer promotions in their decision of purchasing juice drinks, kids’ yogurt, and frozen pizza.
- Female head of households and shoppers with kids spend the most time at the grocery store. Male shoppers and millennials spend the least amount of time in the grocery shopping process.
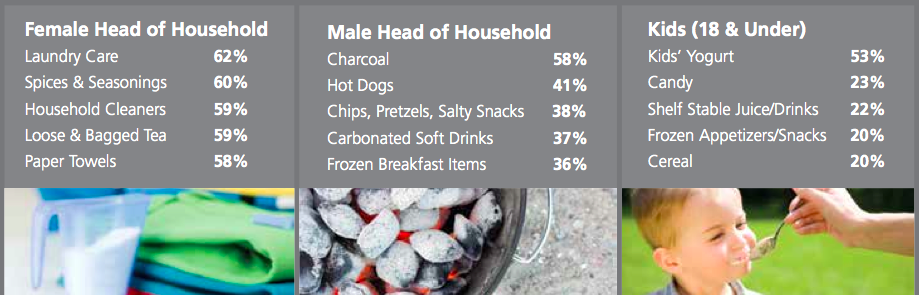
- For food items, female heads of households seem to impact spices and seasoning purchases (60 percent) and decisions on loose bagged tea (59 percent).
- Male heads of households impact on the purchase of casual food items and snacks such as hotdogs at 41 percent, salty snacks at 38 percent, carbonated soft drinks at 37 percent and frozen breakfast items at 36 percent.
- Kids 18 and under impact decisions for kids’ yogurt (53 percent), candy (23 percent), shelf stable juices (22 percent), frozen appetizer and snacks (20 percent), and cereal (20 percent).
- Millennials and Gen X shoppers are the ones most interested in new product discoveries.
- Forty-seven percent of shoppers considered new products in baby food an important factor in their purchasing decision followed by 45 percent in kids yogurt, 39 percent in fresh seafood, 38 percent in meat marinades and rubs, 36 percent frozen breakfast items, and 35 percent in frozen appetizers, and snacks.